
PART V — THE CAPITAL THESIS: Trust Is an Asset Class, and TEM Is the Pricing Model

The Trust Engineering Advantage
PART I—THE GAP: Everyone Has the Research, No One Has the Machinery
PART II—THE DIAGNOSIS: The Research Is Already Measuring TEM (Badly)
PART III—THE LAW: Why Interventions Fail Without Structure
PART IV—THE INSTRUMENTATION: Trust Is Measurable, Predictable, and Designable
PART V—THE CAPITAL THESIS: Trust Is an Asset Class, and TEM Is the Pricing Model
PART VI—THE DEPLOYMENT: How to Build the Trust Envelope in a Real Organization
PART V: THE CAPITAL THESIS
Trust Is an Asset Class, and TEM Is the Pricing Model
There is a quiet truth in modern markets that nobody says out loud:
The market already trades on trust. It just doesn’t have the vocabulary.
It doesn’t call it trust. That would sound soft, immeasurable, unsuitable for institutional portfolios. So it invents euphemisms: execution quality, leadership premium, operational resilience, customer retention, risk-adjusted return, cost of capital, margin stability, human capital factor, workplace wellbeing index.
But strip the euphemisms away, and you find one underlying variable:
Trust architecture.
Companies whose systems reliably produce Dignity, Agency, Accountability, Cooperation, and Adaptability outperform. Every time. Across industries, geographies, market cycles, and analytical frameworks.
The pattern is so consistent that investors have built funds around it. They’ve generated systematic alpha. They’ve published the results. They’ve demonstrated that “soft” factors predict hard returns.
What they haven’t had, until now, is the explanatory model.
Investors discovered that trust matters long before executives did. They just never understood why it works or how to engineer it systematically. They could measure the outputs. They couldn’t specify the inputs.
TEM gives them the why. SIGNAL gives them the how. Capital markets supply the proof.
This section is written for the people who allocate capital: institutional investors, venture capitalists, private equity operators, board members, CFOs, and portfolio managers. If you price companies, this is your pricing model. If you allocate capital, this is your decision framework. If you govern enterprises, this is your fiduciary responsibility.
Trust is not a moral imperative you should care about. Trust is a financial asset you cannot afford to ignore.
The Market Has Been Pricing Trust for Years, Blindly
Let’s start with the numbers investors can’t ignore.
The Human Capital Factor: 520 Basis Points
Irrational Capital, founded by behavioral economist Dan Ariely and David van Adelsberg, developed the Human Capital Factor (HCF) by measuring seven workplace dimensions across thousands of companies. They use publicly available data from sites like Glassdoor, combined with proprietary employee surveys.
What they measure:
Appreciation (employees feel valued)
Low bureaucracy (decision-making isn’t gridlocked)
Fairness and transparency (consequences are predictable)
Teamwork (cooperation functions)
Capacity to adapt and change
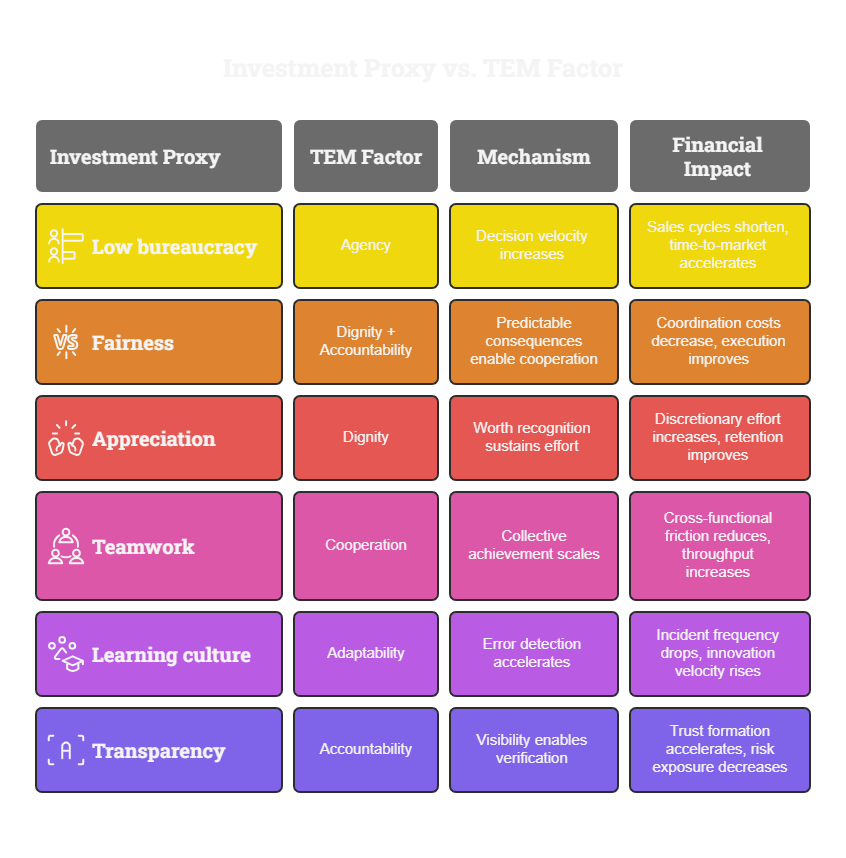
Now translate these through the TEM lens:
Appreciation = Dignity (recognition of inherent worth)
Low bureaucracy = Agency (decision latitude preserved)
Fairness & transparency = Accountability (predictable consequences)
Teamwork = Cooperation (collective achievement possible)
Capacity to change = Adaptability (learning and evolution enabled)
HCF is measuring TEM. Crudely, with proxies and surveys rather than structural instrumentation, but directionally correct.
The results: Companies in the top quintile of HCF scores generate 4% excess annual returns over standard benchmarks. In recent periods, the spread has reached 520 basis points over the S&P 500.
Five hundred and twenty basis points of systematic, repeatable alpha from measuring trust architecture.
Not because kindness is profitable. Because TEM architecture converts to financial performance through measurable mechanisms.
Arthur Brooks, Harvard professor advising Irrational Capital, put it plainly when discussing their analysis of 7,500 publicly traded companies: “If you’re in the top 20% of workplace well-being, you will be, on average, about 520 basis points above the S&P 500 in your stock price over the past year.”
The market isn’t rewarding virtue. It’s pricing throughput, velocity, and resilience—which are outputs of trust architecture.
Oxford/Indeed Well-being Portfolios: 20% Outperformance
When Oxford’s Well-being Research Centre partnered with Indeed to analyze more than 15 million employee surveys across 1,782 U.S. public companies, they weren’t looking for alpha. They were testing whether employee well-being correlated with firm performance.
They found more than correlation. They found systematic outperformance.
The methodology: Rank companies by employee wellbeing scores (measuring job satisfaction, purpose, happiness, and stress). Build equally weighted portfolios of the top 100 companies. Rebalance annually. Hold for two years.
The result: Top-well-being portfolios outperformed the global market by approximately 20% over two years.
A simulated $1,000 investment in January 2021 would have grown to $1,300 by March 2023. The same investment in the S&P 500 would have grown to $1,080.
Twenty percent excess returns from employee well-being.
But here’s what Oxford was actually measuring through their four-metric survey:
Job satisfaction = Contribution (work advances meaningful objectives) + Connection (narrative matches mental model)
Purpose = Agency (capacity for meaningful action) + Dignity (worth through contribution)
Happiness = Multiple TEM factors activated (symptom, not cause)
Low stress = Competency (proficiency demonstrated) + Consistency (reliable protection from harm)
Oxford’s well-being scores measure TEM factor activation. Companies with high scores aren’t just “happy workplaces.” They’re organizations that satisfy the structural conditions for human thriving—and those conditions produce systematic competitive advantage.
The pattern held across industries. Technology showed the highest monthly alpha (33.24 basis points), but even capital-intensive manufacturing showed significant outperformance (25.79 basis points). The effect transcends sectors because TEM is universal; wherever humans cooperate under constraints, these five factors govern whether they thrive or degrade.
Lyubomirsky, King & Diener: Happiness Predicts Success
The meta-analysis of 225 studies covering more than 275,000 participants established directional causality: happiness doesn’t follow success; it precedes it.
Happy people don’t perform better because success made them happy. They succeed more often because the conditions that produce happiness (TEM factors satisfied) also produce effectiveness.
This finding terrified HR departments and confused executives because it seemed to suggest investing in “feelings.” It shouldn’t have. The research showed that TEM factors are leading indicators of performance, not lagging outcomes.
The market never cared about happiness as sentiment. It cared about predictive advantage. Happiness is simply the human-readable signal of a functioning trust architecture.
Companies with employees reporting high well-being have:
Faster decision velocity (Agency working)
Lower coordination friction (Cooperation working)
Better error detection (Adaptability working)
More consistent execution (Accountability working)
Lower attrition (Dignity working)
These operational advantages compound into financial performance. Happiness is the symptom. TEM is the mechanism.
Why TEM Explains What Capital Markets Can Only Observe
Investors can see the alpha. Portfolio managers can measure the outperformance. Analysts can track the correlation.
What they can’t do is engineer it.
They can identify companies with high trust after the fact. They can’t predict which companies will build it or specify how to construct it. They’re trading on outputs without understanding inputs.
This is why HCF funds and well-being portfolios work but remain niche. Investors know these factors matter. They don’t understand why they matter or how to replicate them.
TEM solves this.
Every proxy the portfolios use maps to a TEM factor:
The portfolio managers think they’re picking “culture.”
They’re picking coherent trust systems whose throughput, velocity, and resilience convert directly into financial advantage.
The market is already trading on TEM. It just doesn’t know that’s what it’s buying.
This creates a massive opportunity: first-mover advantage for investors who systematically instrument TEM rather than measure it through sentiment proxies.
Imagine two funds:
Fund A uses employee surveys to identify high-well-being companies after well-being has emerged.
Fund B uses TEM diagnostics to identify companies building trust architecture before the financial advantage manifests
Fund A captures existing alpha. Fund B captures alpha formation.
Fund A is retrospective. Fund B is predictive.
Fund A follows the market. Fund B leads it.
TEM provides the predictive instrumentation that capital markets have lacked.
Trust Value: The Missing Financial Primitive
Every major asset class is built on a foundational primitive, the irreducible variable that drives value:
Equity: Future earnings potential
Bonds: Predictable cash flows
Real estate: Location and scarcity
Commodities: Supply and demand imbalances
Venture capital: Growth potential and market capture
TEM introduces a missing primitive: Trust Value.
Not trust as sentiment. Trust as structural throughput capacity.
The Trust Value Equation
Trust Value = Σ(TEM Factor Strength × Factor Multiplier × Revenue Impact)
Where:
TEM Factor Strength: Measured 0-100 via SIGNAL instrumentation for each of five factors
Factor Multiplier: Industry and company-specific weight (derived empirically)
Revenue Impact: Dollar value per point of factor strength
This isn’t theoretical. It’s calculable.
Worked Example: SaaS Company
Company profile: $50M ARR, enterprise SaaS, 300 employees
Current TEM scores (SIGNAL instrumented):
Dignity: 65/100
Agency: 55/100
Accountability: 70/100
Cooperation: 60/100
Adaptability: 50/100
Empirically derived multipliers (from regression analysis of SaaS benchmarks):
Dignity → Customer Retention: 0.15% retention improvement per point
Agency → Sales Velocity: 0.20% cycle time reduction per point
Accountability → Enterprise Conversion: 0.25% win rate improvement per point
Cooperation → Expansion Revenue: 0.18% NRR improvement per point
Adaptability → Product-Market Fit: 0.22% feature adoption increase per point
Financial impact calculation:
Current state Trust Value: $30M (60% of ARR)
Target state (12-month TEM improvement program):
All factors raised to the 75-85 range.
Projected Trust Value: $45.75M (91.5% of ARR)
Incremental value created: $15.725M
Investment required: $800K (instrumentation + Trust Operations team + training)
ROI: 19.7x in Year 1
This is not a metaphor. This is systematic value creation through trust engineering.
Why Trust Value Matters to Investors
Trust Value explains performance differences that traditional models miss.
Two companies, identical on paper:
Same revenue
Same margins
Same market position
Same technical capabilities
One outperforms by 20% over two years. Why?
Traditional analysis: “Better execution.” (Tautology) TEM analysis: Higher Trust Value enabling faster decision velocity, lower coordination costs, better customer retention, and superior crisis resilience.
Trust Value captures the operational leverage that produces financial leverage.
High Trust Value companies exhibit:
Shorter sales cycles (Agency + Accountability reduces friction)
Higher expansion revenue (Cooperation + Dignity enables customer success)
Lower churn (Dignity + Accountability makes promises reliable)
Faster product feedback loops (Adaptability + Cooperation enable learning)
Stronger crisis absorption (All five factors maintain cohesion under stress)
Better regulatory relationships (Accountability + Dignity builds institutional trust)
Lower cost of talent replacement (Cooperation + Agency reduces attrition)
Higher innovation yield (Adaptability + Agency enables risk-taking)
Every one of these is a valuation multiplier. Every one flows from the Trust Envelope.
Trust is not soft. Trust is throughput.
Trust Debt: A Leading Indicator of Financial Collapse
Every sophisticated investor understands technical debt. Code quality degrades. Shortcuts compound. Eventually, the system becomes unmaintainable and productivity collapses.
Trust Debt is more dangerous because it predicts failures that financial metrics miss until it’s too late.
What Trust Debt Measures
Trust Debt = accumulated backlog of:
Unkept promises (Accountability failure)
Unresolved dignity violations (Dignity breach)
Ignored escalations (Agency blocked)
Inconsistent consequences (Accountability unpredictability)
Stalled commitments (Cooperation breakdown)
It’s the compound interest on broken trust.
Why Trust Debt Is Predictive
Trust Debt fires warning signals months or years before financial indicators:
Trust Debt predicts attrition spikes before HR sees exit interviews pile up. Employees decide to leave 6-12 months before they actually do, when they stop believing that escalations will be resolved or that their dignity will be protected.
Trust Debt predicts compliance failures before auditors find violations. When accountability infrastructure breaks down, corners get cut, documentation lapses, and regulatory exposure accumulates invisibly.
Trust Debt predicts customer churn before revenue declines. Customers stop renewing when promises aren’t kept, or support escalations die in queues, problems that show in Trust Debt months before they appear in financial statements.
Trust Debt predicts leadership collapses before boards intervene. When Trust Flows break and Atmospheric Breaks cluster around executives, organizational effectiveness degrades long before the crisis becomes visible to governance.
Trust Debt predicts product failures before engineering reports outages. When psychological safety collapses (Adaptability violation), people stop surfacing problems early, and minor issues compound into catastrophic failures.
In capital markets, leading indicators are worth their weight in alpha. Trust Debt is a leading indicator that signals financial deterioration quarters in advance.
How Investors Should Use Trust Debt
For public equity: Screen for companies with rising Trust Debt as short candidates or risk factors. Monitor Trust Debt trends in portfolio holdings as an early warning system.
For private equity: TEM due diligence reveals Trust Debt before acquisition. Post-acquisition Trust Debt monitoring prevents value destruction during integration.
For venture capital: Portfolio company Trust Debt dashboards predict which companies will scale and which will hit cultural ceilings. Trust Debt paydown accelerates path to next funding round.
For credit: Trust Debt accumulation predicts operational failures that threaten debt service capacity before financial covenants trip.
Boards should treat Trust Debt reports the same way they treat financial debt covenants: as hard constraints requiring immediate action.
Because, unlike financial debt, Trust Debt has no restructuring option. You can’t refinance broken trust. You can only pay it down through sustained action.
TEM as Valuation Infrastructure
Let’s make the explicit claim:
TEM is the first systematic pricing model for human thriving in enterprise systems.
Not “organizational culture.” Not “employee engagement.” Human thriving is an operational infrastructure that produces financial outcomes.
What TEM Explains That Traditional Models Miss
Traditional valuation tries to price human capital through proxies:
Management quality (but can’t specify what makes management effective)
Brand trust (but can’t explain how trust forms or degrades)
Customer loyalty (but can’t predict when loyalty will break)
Employee engagement (but can’t engineer engagement systematically)
Operational efficiency (but can’t identify efficiency sources)
These are second-order outputs. They emerge from something more profound.
TEM is the first-order function.
TEM explains:
Why some companies execute, and others stall: Agency enables decisions; lack of Agency creates gridlock.
Why some cultures scale, and others break: TEM coherence across organizational boundaries; TEM violations at scale create fractures.
Why some firms survive shocks, and others collapse: The Adaptability + Cooperation loop maintains cohesion under stress.
Why some teams innovate, and others freeze: Psychological safety (Adaptability) + Agency enables risk-taking.
Why some leaders create loyalty, and others create churn: Dignity + Accountability satisfaction vs. violation.
Every organizational mystery has a TEM diagnosis.
Every performance difference has a TEM explanation.
Every valuation gap has a TEM root cause.
TEM as Due Diligence Framework
Pre-investment assessment:
Rather than asking “Do they have good culture?” (unmeasurable, subjective), ask:
What are the TEM scores for each factor?
Where are Atmospheric Breaks concentrated?
What is the Trust Debt balance?
Are Incentive Exposures undermining stated values?
What is Trust Velocity across key stakeholder journeys?
These questions are answerable, measurable, and predictive.
Post-investment value creation:
Rather than generic “talent strategy” and “culture initiatives,” implement:
TVM operating system deployment
SIGNAL instrumentation across divisions
Friction Map optimization
Trust Debt paydown protocols.
TEM factor improvement roadmaps with financial impact modeling
Value creation becomes systematic rather than aspirational.
Exit optimization:
Companies with high TEM scores command valuation premiums because:
Lower perceived integration risk (trust architecture is portable)
Higher retention likelihood (employees stay through transition)
Faster synergy realization (cooperation infrastructure enables coordination)
Lower due diligence discount (accountability infrastructure reduces hidden risk)
Acquirers pay more for trustworthy companies because they are predictable.
Making Trust a Fiduciary Responsibility
Once trust becomes measurable through SIGNAL and priced through TEM, it stops being optional.
Boards gain new responsibilities:
Benchmark TEM factors across divisions, against peers, over time.
Monitor Trust Debt as actively as financial debt, with the same urgency when thresholds are breached.
Track Trust Velocity as a forward indicator of execution capacity.
Audit Atmospheric Breaks as control failures requiring investigation.
Verify Incentive Alignment with TEM rather than accepting stated values.
Ensure SIGNAL instrumentation is in place and producing actionable data.
Investors gain new capabilities:
Price trust architecture into valuation models rather than treating it as qualitative.
Use Trust Velocity as forward guidance on revenue acceleration.
Monitor Trust Debt as a leading indicator for portfolio risk management.
Demand TEM disclosure in investment memoranda and board reporting.
Structure incentives around improving the TEM factor rather than generic “culture.”
CEOs gain new accountability:
Report Trust Value to boards quarterly with the same rigor as financial performance.
Explain Trust Debt accumulation, and paydown plans.
Demonstrate TEM factor trends with intervention plans for degraded factors.
Surface Atmospheric Breaks proactively rather than waiting for a crisis.
Prove incentive coherence with evidence of alignment between stated values and actual rewards.
CFOs gain new assets to manage:
Trust Value on the balance sheet (eventually, as methodology standardizes)
Trust Debt as a liability requiring provisioning and management.
TEM ROI modeling for capital allocation decisions.
Trust Velocity as a financial guidance operational metric.
Trust stops being a “nice to have” that HR owns.
Trust becomes infrastructure that finances, prices, manages operations, and governance oversees.
If you ignore TEM, you’re mispricing the company. If you underinstrument SIGNAL, you’re flying blind. If you allow Trust Debt to compound, you’re courting value destruction.
Boards don’t need a new belief system. They need a better pricing model.
The Strategic Implication for Capital Allocators
The research established that trust predicts performance. TEM explains the mechanism. SIGNAL provides the instrumentation. Now, capital markets can systematically invest in trust architecture.
The opportunity is massive:
For active managers: First-mover advantage in TEM-based stock selection before the factor becomes crowded
For index providers: Create TEM-weighted indices that outperform cap-weighted benchmarks
For private equity: Systematize value creation through TVM implementation rather than generic “operational improvement.”
For venture capital: Predict which startups will scale by diagnosing TEM architecture early
For credit investors: Use Trust Debt as an early warning system for default risk.
For activist investors: Push for TEM disclosure and SIGNAL implementation as catalysts for value creation.
The market has been trading on trust blindly for years.
The blind phase is ending.
Companies that instrument TEM will attract capital at a lower cost. Investors who price TEM systematically will generate systematic alpha. Boards that govern with TEM will protect and create value.
The choice is binary:
Engineer trust as infrastructure, or continue treating it as intangible culture, and watch competitors capture the premium.
Instrument trust as a measurable asset, or continue flying blind while markets reprice around you.
Capitalize trust as an investment thesis, or continue leaving alpha on the table while others harvest it.
TEM is not a culture framework. TEM is a valuation engine.
And the engine is running.
The only question is whether you’ll use it before your competitors do.