PART IV — THE INSTRUMENTATION: Trust Is Measurable, Predictable, and Designable

The Trust Engineering Advantage
PART I—THE GAP: Everyone Has the Research, No One Has the Machinery
PART II—THE DIAGNOSIS: The Research Is Already Measuring TEM, Just Poorly
PART III—THE LAW: Why Interventions Fail Without Structure
PART IV—THE INSTRUMENTATION: Trust Is Measurable, Predictable, and Designable
PART V—THE CAPITAL THESIS: Trust Is an Asset Class, and TEM Is the Pricing Model
PART VI—THE DEPLOYMENT: How to Build the Trust Envelope in a Real Organization
PART IV: THE INSTRUMENTATION
Trust Is Measurable, Predictable, and Designable
If the first three parts established the architecture and the physics, Part IV delivers what every executive secretly wants but will never say out loud:
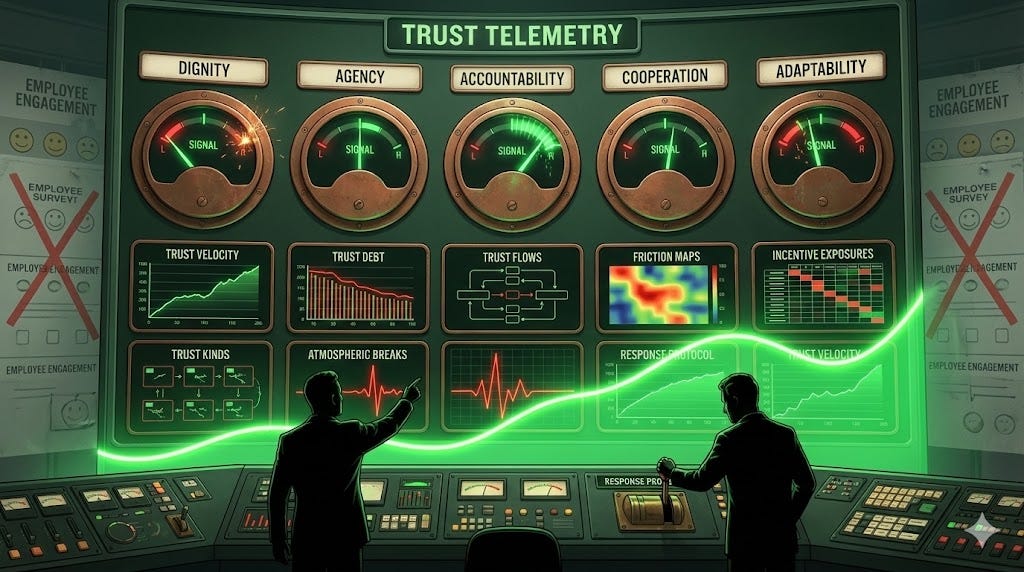
A dashboard.
Not a vibes dashboard. Not an HR “engagement pulse” that measures sentiment three months after the damage is done. Not another survey that asks “On a scale of 1-10, how happy are you?” and generates data that goes directly into a deck that goes directly into a drawer.
A telemetry system that measures trust the way an engineer measures structural load, vibration frequency, thermal stress, or circuit integrity.
Because once you treat trust as infrastructure—load-bearing, failure-prone, subject to stress, critical to system function—you can measure it like infrastructure.
And that is exactly what SIGNAL does.
The Problem with Current Measurement
Here’s what companies measure today:
Annual engagement surveys that tell you what happened 11 months ago, right before they ask the question. By the time you get results, your top performers have already accepted offers elsewhere.
Pulse surveys that improve frequency but not actionability. You learn morale is declining. What do you do about it? The survey doesn’t tell you which structural factor failed or how to repair it.
Exit interviews that function as autopsies. “Why did you leave?” “Because I didn’t feel valued.” “Why didn’t you feel valued?” “Because nothing ever changed when I raised concerns.” By the time you hear this, the knowledge is gone, the team is disrupted, and the replacement cost is six months’ salary.
eNPS scores that measure outcome without diagnosing cause. A score of 20 is “bad.” What specifically is broken? The metric doesn’t say. It just confirms that you already suspected a problem.
Culture surveys that measure the aspiration gap. “We value innovation.” (Agree/Disagree). The responses tell you that employees don’t believe the slogan. They don’t tell you which of the five TEM factors is degraded or what operational change would restore it.
The entire measurement apparatus floats at the symptom layer. It measures how people feel without instrumenting the conditions that produce those feelings.
This is like measuring fever without checking for infection, inflammation, or organ function. You know something’s wrong. You don’t know what or where.
SIGNAL fixes this.
SIGNAL: The Emotional Telemetry Layer
SIGNAL is the instrumentation layer that sits on top of the Trust Envelope.
If TEM is the structure, SIGNAL is the sensor grid. If TEM is the decision surface, SIGNAL is the data exhaust that shows where decisions succeed or fail. If TEM is the blueprint, SIGNAL is the monitoring system that shows where the building is sound and where cracks are forming.
The acronym unpacks the methodology:
Surface friction (make trust erosion visible before it compounds) Instrument trust signals (measure TEM factors as process variables) Guide behavior (provide decision frameworks based on real-time data) Normalize safe practice (embed trust-preserving behavior as default) Accelerate trust velocity (reduce time-to-trust across stakeholder journeys) Loop learning (capture lessons and feed them back into system design)
That’s the loop. That’s the function. That’s the operating system corporate culture has lacked since the org chart was invented.
SIGNAL doesn’t measure “feelings.” It measures the conditions that produce feelings:
Where meaning is generated (productive friction that activates TEM)
Where effort is wasted (unproductive friction that violates TEM)
Where agency collapses (decision bottlenecks and approval gridlock)
Where cooperation stalls (handoff failures and alignment gaps)
Where accountability breaks (consequence inconsistency and feedback loop failure)
Where adaptability is throttled (psychological safety violations and learning blockages)
Feelings are downstream outcomes. Instruments capture the upstream physics.
Once you instrument the conditions, you stop chasing sentiment and start managing infrastructure.
The Core Measures of a Trust Instrumentation System
Trust Velocity
Definition: How fast trust forms under normal operating conditions.
High-trust systems onboard new hires faster. They resolve conflicts earlier. They recover from disruptions quickly. They close deals in fewer touches. They expand accounts with less friction.
Trust Velocity is the “time-to-trust” metric across every stakeholder journey: employee onboarding, customer acquisition, partnership formation, vendor relationships, and even regulatory engagement.
It’s as operational as time-to-resolution, time-to-deployment, or time-to-first-value.
Measurement approach:
Employee onboarding: Days until new hire makes first independent decision; days until they escalate only when genuinely needed rather than from fear
Customer sales: Number of touches required to move from discovery to contract; percentage of deals requiring executive involvement vs. solved at the rep level
Cross-functional projects: Time from handoff to acceptance; time from question to answer; percentage of work that completes without escalation
Low Trust Velocity shows up as:
Slow decision-making across the board
Endless escalations where people ask permission instead of exercising judgment
“I’ll check with my manager,” which adds days to every cycle.
Cross-functional work stalls in handoffs
Employees taking months to believe what leaders say (announcement → skepticism → verification → eventual belief)
New customers requiring extensive proof before expanding engagement
What it diagnoses: When Trust Velocity is low, at least one TEM factor is degraded. Usually, it’s Agency (people lack decision authority) or Accountability (consequences are unpredictable, making action risky).
Intervention target: Restore clarity to decision rights, reduce approval requirements, and establish predictable escalation paths with documented resolutions.
Trust Debt
Definition: The accumulated backlog of unkept promises, unanswered escalations, unresolved dignity violations, and stalled commitments.
In software, technical debt slows delivery. Every shortcut compounds. Every deferred refactoring makes the next change harder. Eventually, the system becomes unmaintainable.
In human systems, trust debt works the same way. Every promise broken. Every concern ignored. Every unfair treatment tolerated. Every explanation withheld. It accumulates. It compounds. It metastasizes.
Symptoms of high Trust Debt:
Repeated questions about the same policy because no one believes the first answer
Cynicism in the absence of malice (”They’ll say one thing and do another”)
“We’ll see if they actually follow through this time.”
Leaders losing persuasion power even when they’re objectively correct.
Good ideas are dismissed because “we tried that before and nothing happened.”
Proposals requiring mountains of proof because the default is distrust
Measurement approach:
Escalation backlog: Number of issues raised that haven’t been resolved or explained
Promise tracking: Percentage of commitments made in all-hands that are delivered on time
Grievance latency: Days from complaint to resolution or documented explanation
Repeat incidents: Percentage of problems that recur without a system-level fix
What it predicts: Trust Debt is a leading indicator. It predicts attrition spikes before they show in data. It predicts leadership failures before they become crises. It predicts compliance violations before auditors find them. It predicts cultural breakdown before it’s visible to executives.
Critical insight: You don’t fix Trust Debt with communication. You don’t “town hall” your way out of it. You pay it down through action: closing escalations, keeping promises, resolving grievances, explaining decisions, and demonstrating consequence consistency over time.
Trust Debt reduction is the single highest-leverage intervention most companies can make. But it requires accountability infrastructure, which most companies lack.
Trust Flows
Definition: The directional movement of trust through the organization.
Trust is not uniformly distributed. It pools in some places and evaporates in others. It flows easily between some teams and barely crosses other boundaries. Understanding flow patterns reveals where the system works and where it breaks.
Common patterns:
Engineering trusts laterally and downward but not upward: Engineers trust each other and trust their direct reports, but don’t trust directors or executives to make sound technical decisions or honor technical constraints.
Sales trusts outward more than inward: Account executives trust their customers more than they trust their own implementation teams to deliver
Executives trust dashboards instead of people: Leadership operates from metrics rather than ground truth, which creates lag and misalignment.
Support teams trust customers, but product teams don’t: Customer success teams believe customer problems are real; product teams believe they’re user error.
Measurement approach:
Trust surveys segmented by boundary: Do you trust people in your team? In adjacent teams? In leadership? In partner organizations?
Collaboration friction mapping: Which cross-functional workflows complete smoothly vs. which require escalation?
Information flow analysis: Where does information travel freely, vs. where does it get filtered or blocked?
What healthy flows look like:
Strong lateral trust (peer-to-peer within functions)
Strong upward trust (teams trust leadership)
Strong cross-functional trust (silos cooperate effectively)
Limited dependency bottlenecks (work doesn’t pile up waiting for specific people)
What unhealthy flows look like:
Trust deserts are separated by trust fortresses.
Information hoarding
“Us vs. them” mentalities
Coordination requiring executive intervention
Intervention target: When flows are broken, the problem is usually structural: misaligned incentives, unclear ownership boundaries, or repeated accountability failures at specific interfaces. Fix the interface, not the people.
Atmospheric Breaks
Definition: Points where the emotional climate fractures suddenly and severely—fear spikes, psychological safety collapses, dignity gets violated, or power becomes unpredictable.
Atmospheric Breaks are not events in the sense of “something happened.” They’re conditions: the presence of a person, policy, or pattern that destabilizes the trust envelope in a specific region of the system.
Examples:
A VP who retaliates when people bring bad news
A team lead who stonewalls direct reports asking for guidance
A policy change was announced with no explanation or input from stakeholders.
A surprise reorganization that invalidates prior commitments
A bad actor tolerated too long, signaling that behavior has no consequences.
A public reprimand that violates dignity norms
An arbitrary decision that destroys accountability and predictability
Critical insight: One Atmospheric Break can neutralize ten positive interventions. You can run blameless post-mortems, invest in psychological safety training, preach transparency, but if one executive retaliates against a single person who escalated a concern, the entire organization watches, learns, and adjusts behavior.
Measurement approach:
Incident tracking: Not just “incidents” as in outages, but dignity violations, trust breaches, and safety collapses
Localized sentiment drops: Sudden engagement score declines in specific teams or departments
Attrition clustering: Multiple departures from the same team in short timeframes
Escalation suppression: Reduction in concerns raised (false positive: means people stopped speaking up, not that problems stopped)
What it diagnoses: Atmospheric Breaks reveal where leadership behavior or policy inconsistency creates localized trust collapse. The problem is rarely systemic; it’s concentrated around specific people or decisions.
Intervention target: Rapid response. Address the break immediately. If it’s a person violating norms, enforce consequences. If it’s a policy, explain or reverse it. If it’s a decision, provide a rationale. Atmospheric Breaks compound exponentially if ignored.
Friction Maps
Definition: Maps of where friction is productive (activates TEM factors, generates meaning) vs. unproductive (violates TEM factors, destroys meaning).
This directly operationalizes the Law of Friction and Meaning from Part III.
Productive friction creates:
Decision requirements that exercise agency
Reciprocal commitments that establish accountability
Collective achievement opportunities that enable cooperation
Learning moments that build adaptability
Recognition or worth-protection that honors dignity
Unproductive friction creates:
Delays without quality improvement
Approvals without reciprocal obligation
Bottlenecks that concentrate power arbitrarily
Error punishment that prevents learning
Surveillance that violates dignity
Measurement approach:
Decision latency mapping: How long does it take to get yes/no answers at each organizational boundary?
Shadow approval identification: Where do formal approvers exist, but informal gatekeepers actually control outcomes?
Escalation dead-end tracking: Where do requests go to die?
Work stoppage analysis: Where does work consistently pause waiting for something?
What Friction Maps reveal:
Organizations think they know where friction exists. They’re usually wrong. Friction Maps show where the stated process differs from the actual process, where the stated decision rights differ from the actual power distribution, and where bottlenecks concentrate.
Common findings:
Approval chains that add three days and zero value
“Collaborative decision-making” means ten stakeholders, each with veto power.
Teams that need three approvals to spend $500, but can deploy code to production with one review.
Processes designed for a 100-person company are still running at 1,000 people.
Intervention target: Friction redistribution. Remove unproductive friction ruthlessly. Add productive friction deliberately where it activates TEM and generates meaning.
Incentive Exposures
Definition: Where incentives—formal or informal—undermine the Trust Envelope despite espoused values.
This is the silent killer of trust systems. You can have a perfect TEM design on paper. But if the incentive structure rewards behavior that violates TEM factors, the incentive structure wins every time.
Examples of exposure:
Collaboration expected, individual output rewarded: “We’re one team” in meetings, stack-ranked performance reviews in private.
Psychological safety preached, errors punishable: “Speak up if you see problems” in training, career damage when you actually do
Empowerment sloganed, approvals required: “You’re empowered to make decisions” in onboarding, “Why didn’t you get sign-off?” in reality
Transparency valued, promotion decisions opaque: “We value openness” in values statement, advancement happening behind closed doors.
Customer focus claimed, internal metrics prioritized: “Customer obsession” on posters, bonuses tied to activity metrics that ignore customer outcomes.
The mechanism: Humans optimize for what’s measured and rewarded, not what’s stated and hoped. When the incentive structure contradicts the trust structure, people follow incentives, and trust collapses.
Measurement approach:
Incentive archaeology: Map what actually drives promotion, recognition, and resource allocation
Stated vs. revealed preferences: Compare official criteria against actual outcomes.
Behavior pattern analysis: What behaviors increase, decrease, or persist despite stated values?
Exit interview pattern matching: Do people leave for reasons that contradict stated priorities?
What it diagnoses: Incentive Exposures reveal where the organization is lying to itself. Not maliciously—structurally. The system says one thing and rewards another.
Intervention target: Incentive redesign to align with TEM factors. If you want cooperation, reward helping behavior. If you want adaptability, reward learning from failure. If you want accountability, reward consequence consistency. If you want agency, reward good judgment exercised independently. If you want dignity, make violations career-limiting for violators, not victims.
The Case Data: What Happens When You Instrument Trust
This isn’t theoretical. We have case data.
A mid-market SaaS company—1,200 employees, approximately $280M ARR, operating in competitive enterprise software—implemented a full TEM + SIGNAL stack across engineering, customer success, and revenue operations. They didn’t meditate their way to trust. They didn’t run workshops on “psychological safety.” They instrumented the Trust Envelope and responded to what the data revealed.
Timeline: Nine months from initial assessment to validated results.
Interventions: Not culture change. Architecture change.
Friction mapping exposed decision bottlenecks; decision rights were clarified and documented.
Trust Debt audit revealed 200+ unresolved escalations; closure protocols were implemented with 30-day SLAs
Atmospheric Break response: One VP removed after repeated retaliation against escalations
Incentive redesign: Sales comp restructured to reward expansion revenue, not just new logos; engineering promo criteria revised to value helping behavior
Accountability infrastructure: Blameless post-mortems mandated for P0/P1 incidents with tracked action items
Results over nine months:
Deal Cycle Time: ↓ 27% Cross-functional bottlenecks collapsed when friction maps exposed where decisions were getting stuck. Sales stopped waiting three days for solution architects. Solutions architects stopped waiting for product approvals. Product had more apparent decision authority.
Customer NPS: ↑ 18 points. Accountability loops were redesigned so customer issues couldn’t die in Slack threads. Every escalation got owner, SLA, and resolution tracking. Customers stopped experiencing “I’ll look into it” followed by silence.
Voluntary Attrition: ↓ 31% Dignity violations and atmospheric breaks were surfaced early through instrumentation, before they metastasized into resignations. The VP removal sent a signal: retaliation has consequences. Trust Debt paydown showed: we follow through on commitments.
Escalation Volume: ↓ 34% Employees had more agency and more transparent accountability. Fewer problems required upward intervention because people had decision authority and reciprocal obligation frameworks.
Engineering Incident Frequency: ↓ 22% Adaptability increased through blameless post-mortems and systemwide learning loops. Psychological safety enabled earlier problem surfacing. Learning capture prevented repeat errors.
CSAT Recovery Time: ↓ 43% Cooperation improved through clearer handoffs and reduced “not my team” responses. When issues crossed boundaries, ownership was explicit, and consequences for dropping handoffs were real.
Manager Trust Rating: ↑ 29% Leaders were instrumented—not surveilled—and learned how to respond to friction instead of suppressing it. Trust Velocity metrics showed which managers enabled teams vs. bottlenecked them. Coaching focused on restoring TEM factors, not generic “leadership development.”
This was not a culture change. This was architecture with sensors.
The company didn’t become “happier” through aspiration. They became more trustworthy through engineering. Happiness followed as an emergent property.
TEM as the Decision Surface; SIGNAL as the Sensor Grid
TEM answers the question: What conditions must exist for trust to form?
SIGNAL answers the question: Where are those conditions holding, and where are they breaking?
TEM is the blueprint that specifies the five factors—Dignity, Agency, Accountability, Cooperation, Adaptability—and defines the cooperation-adaptability loop as the engine of thriving.
SIGNAL is the instrumentation layer that shows where those factors exist or fail in practice.
Together, they become an operational system:
TEM defines dignity, agency, accountability, cooperation, and adaptability as structural requirements
SIGNAL measures where they exist or degrade
LFM explains why interventions succeed or fail based on friction dynamics
The CHAIN translates TEM factor activation into business outcomes and financial value.
Trust Debt quantifies the cost of accumulated violations.
Trust Velocity quantifies the speed of trust formation.
Atmospheric Breaks map structural threats that can neutralize positive work
Incentive Exposures reveal where reward structures contradict trust structures.
Every signal is actionable. Every metric is operational. Every measurement becomes a design decision.
When Trust Velocity drops in sales, you know Agency or Accountability is degraded—decision rights are unclear, or consequences are unpredictable.
When Trust Debt accumulates in engineering, you know promises are being broken, or escalations are being ignored—Accountability is failing.
When Atmospheric Breaks cluster around a specific leader, you know Dignity or Agency is being violated locally—intervention is required.
When Friction Maps show coordination taking weeks, you know Cooperation infrastructure is missing—handoffs need redesign.
When Incentive Exposures show individual rewards despite collaboration requirements, you know the system is lying to itself—incentives need realignment with TEM.
The dashboard doesn’t just report problems. It diagnoses root causes and predicts consequences. It converts trust from mood to metric.
The Conversion Moment: Trust Becomes Operational
This is the moment of conversion for the reader.
Before SIGNAL, trust felt intangible. Something you “built” through retreats and values statements. Something you “sensed” through hallway conversations and exit interviews. Something that either existed or didn’t, with no clear path from here to there.
After SIGNAL, trust behaves like:
Throughput (how much gets done)
Latency (how long decisions take)
Load (how much stress the system carries)
Packet loss (how much information disappears in handoffs)
Yield (percentage of initiatives that complete successfully)
Failure rate (frequency of breakdowns)
Cycle time (duration from start to finish)
The emotional world becomes instrumented without becoming dehumanized.
You don’t stop caring about people. You start measuring the conditions that determine whether people can thrive.
You don’t replace humanity with metrics. You replace guesswork with precision.
Trust is no longer a poster. Trust is a dashboard. Trust is a system variable. Trust is a performance asset.
And once you can measure trust, you can manufacture it.
Not through aspiration. Through architecture.
Not through workshops. Through instrumentation.
Not through culture change. Through structural design.
The research proved trust matters. TEM explained the mechanism. LFM revealed the physics. SIGNAL provides the instrumentation.
Now trust is engineerable.
Part V takes us into capital markets—where trust becomes not only measurable but priced, allocated, and capitalized.
Just like any other form of infrastructure.
Because that’s what it is.